In the operating system Linux you need to check from time to time the performance of the system, usage of memory and system resources. Tool htop is simple, handy and clear manager of processes.
What is htop
htop is interactive tool for monitoring system resources, that works on the text or more precisely console bases (CLI). Often it is used when Unix or Linux does not offer a clear information about running processes, like tool top. Except monitoring it allows to display and manage processes. Tool is developed by Hisham Muhammad.
Advantages of htop against top
- functionality – except system monitoring it allows the management of running processes and their displaying
- clearness – it displays all running processes, not only those, that takes up the most performance
- graphics – better text-graphic interface in which the information and elements are colored differently
- UI – simple text user interface for management processes with the option to use cursor
htop is easily undertandable and user-friendly. Thanks to the colored differentiation of the elements you can easily determine, what state the system is in. You can go trough the running processes by keyboard but also by mouse. With that you can easily and quickly resolve otherwise annoying tasks like send a signal kill to a process – you need not to find and manually rewrite the process identifier (PID) to the terminal command. htop can also display monitoring processes like tree, so you can see nicely the hierarchy of the running processes.
Installing htop tool
Tool htop can be installed to the system with simple terminal command from the repository of the according distribution.
For Debian, Ubuntu or other operating system based on Debian:
# sudo apt-get install htop
For CentOS, RHEL, Fedora or other operating system based on distribution Red Hat Linux:
# sudo yum install htop
User interface
In the top section you can see multiple column indicators. Each indicator is marked with a number representing one of the CPU’s cores. Then the indicator shows the usage of memory displayed as “Mem” and indicator of storage space usage swap marked as “Swp”.
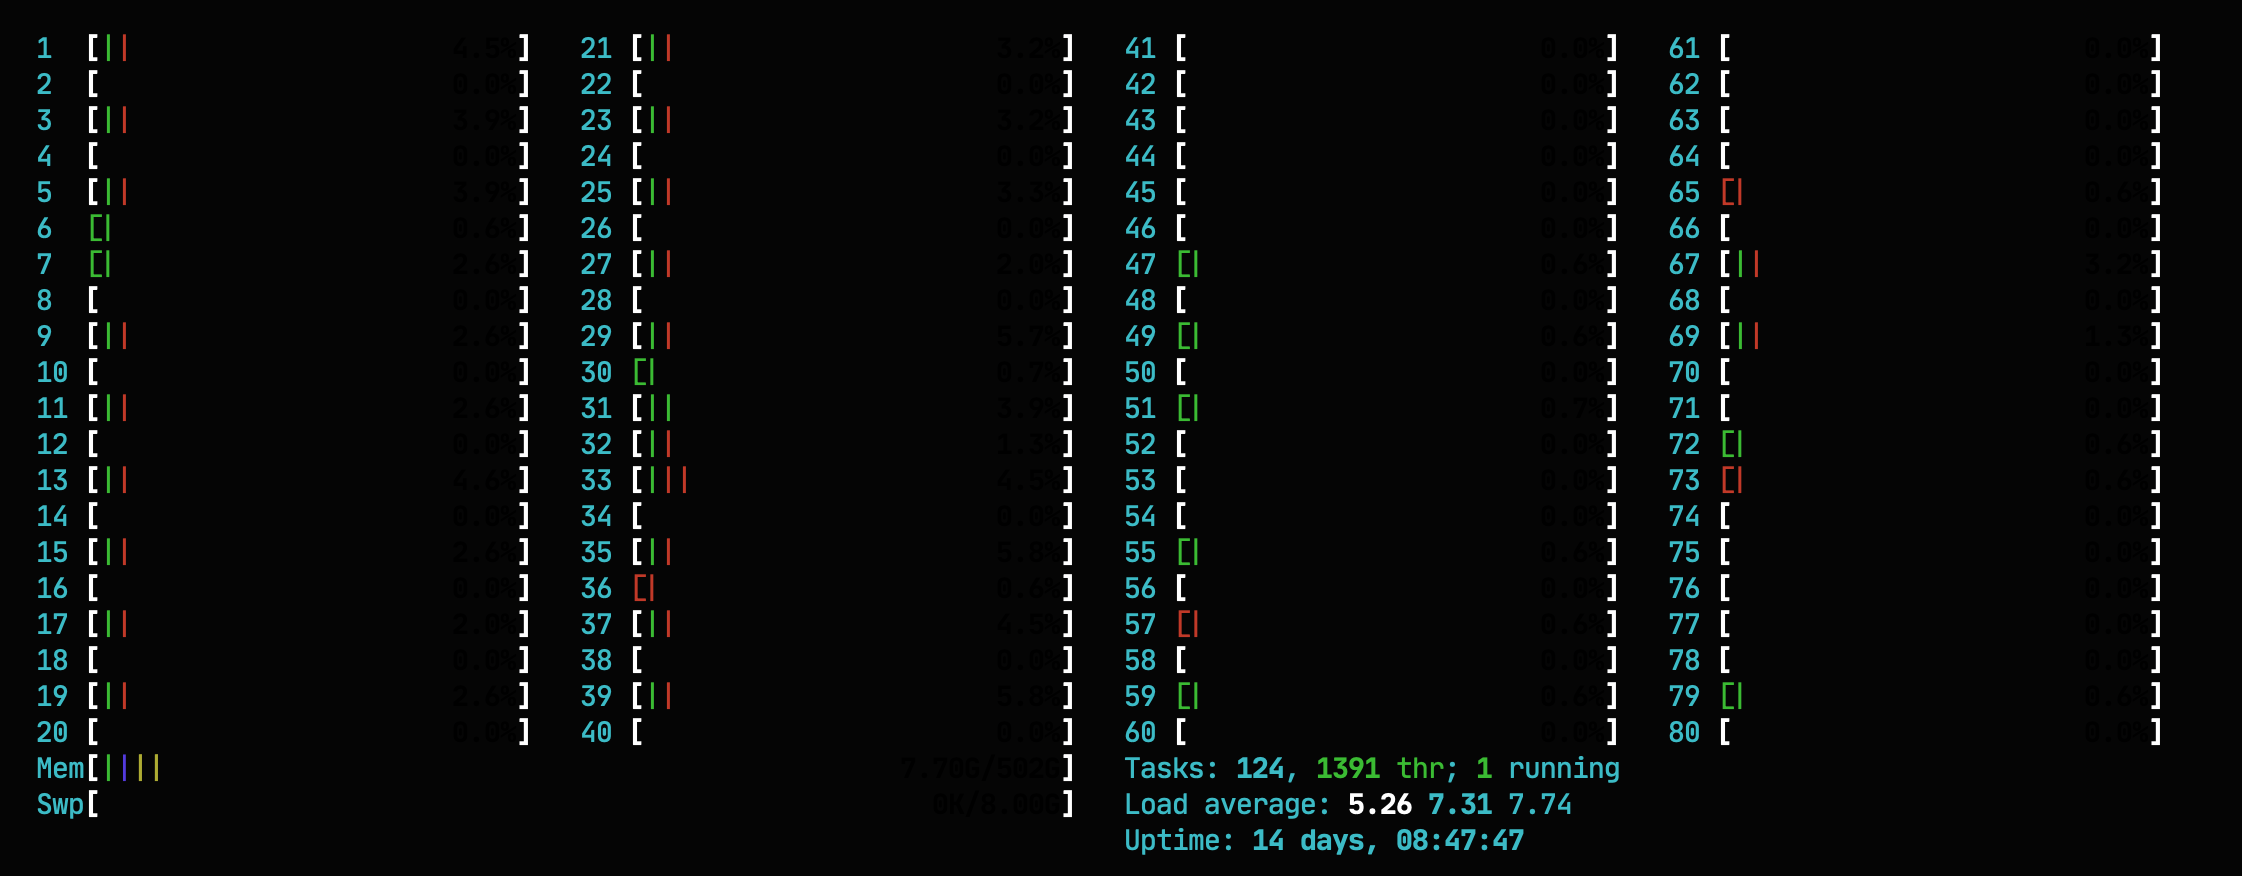
These indicators represent the usage of the system resources, while the value at the end is shown as a number with a specific unit.
Note: described colors and their representation in application belongs to the Default color scheme, for other schemes it may differ.
Colors for CPU usage indicator:
- blue – low priority processes
- green – normal processes (user)
- red – core system processes
Colors for memory and swap:
- blue – pages of buffer memory
- green – used pages of memory
- yellow – pages of cache
Along the indicators there is also the summary of tasks, average load of CPU and overall time of system run.
- Tasks – represents the number of open processes in the system. All that is displayed is the total number of processes, number of threads, that all processes are divided to, and number of currently active tasks.
- Load average – represents the amount of calculations done by CPU. For example single core CPU with 100% load will have value of 1.0, quadruple core CPU will have this value on 4.0 with 100% load. Three values are displayed – average per 1 minut, 5minutes and 15 minutes.
- Uptime – represents the period when system was running from the last restart
Information about processes
htop displays running processes, that are monitored in the clear list. Columns and items, are represented:
| PID | Proces identifier |
| USER | Proces owner |
| PRI | Priority of the process according to the core |
| NI | Priority of the process managed by user |
| VIR | Amount of virtual memory used by the process |
| RES | Amount of physical memory used by the process |
| SHR | amount of shared memory used by the process |
| S | Current process status |
| CPU% | Percentage of CPU load used by the process |
| MEM% | Percentage of used memory |
| TIME+ | Time from the process start measured in so called clock ticks |
| Command | The command that started the process |
Shortcuts and control
- F1 – help
- F2 – adjust display, colors and preferences
- F3 – search processes
- F4 – process filter
- F5 – display process tree
- F6 – sort processes by the columns
- F7 – lower priority of the selected process
- F8 – increase priority of selected process
- F9 – stop the selected process with kill command
Bottom section of the user interface displays the menu commands:
Useful key shortcut
u: displays all processes owned by the specified userp: sort by the high CPU loadm: sort by the high memory loadt: sort by timespacebar: select processc: select processshift+u: clear selectionshift+f: highlight and monitor processshift+h: display/hide processes of core and usersa: set which CPU cores the process can use (if available)i: set IO (input-output) priorityh: help menushift+i: invert sortingl: display files opened by the process