
Do you know the performance of your website? How many visitors download or buy anything? These questions can be answered from the data provided by the Google Analytics. Google Analytics is a very strong tool, that uses a thorough analysis of the website.
In a case of e-shop it is an ideal tool for measuring conversions, the number of orders and their values. It is a great tool and it is completely free. For correct Google Analytics set up, it is necessary to have a Google account and have access to the files of your website that shall be analyzed.
For access to the statistics we would recommend the service Google Analytics, that is very clear and provides complex statistics about status and visitors on your website.
Creating Google Analytics account
Enter an address http://www.google.com/analytics to the address line of your browser. In the top right corner select “Create account” and enter the necessary details.
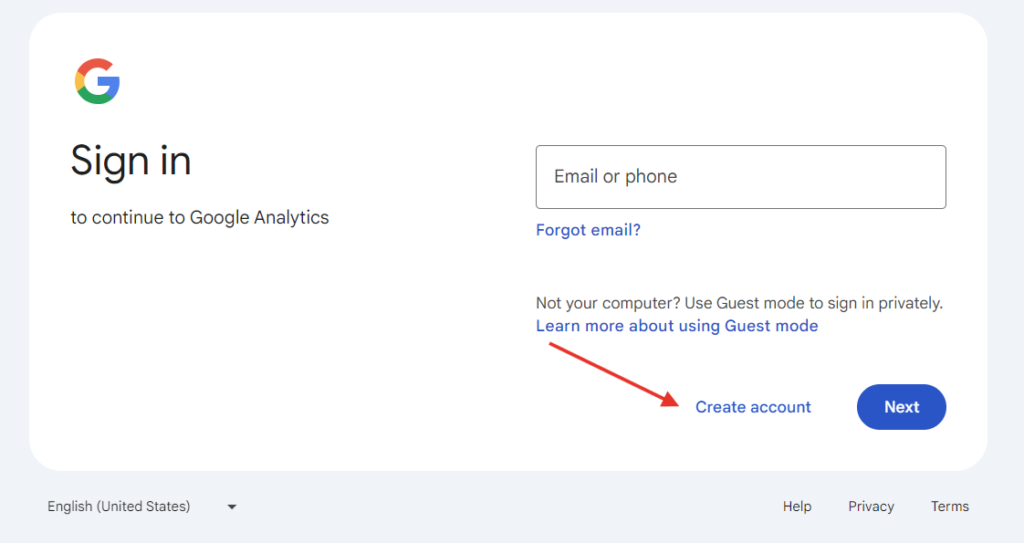
After these steps you will get to a screen where you need to enter the basic information about your website. Mostly name of your website and URL address (e.g. “mynewsite.tld”). Do not forget to enter the correct time zone. In the Google Analytics, you can monitor separate information not only by days but even by hours. In a case you would use pacific time, all of the data will be displayed in the chosen time which in this case will be off by seven hours. The correct time zone for Central Europe is “(GMT+01:00) -Central European time – Prague”. Confirm the registration by selecting “Get tracking ID” and confirm the license agreement of Google company.
Installing tracking code
After you receive the identification chain you will be redirected to the administration of Google Analytics. On the right screen you will see a java script code, that has to be implemented on each page of your website, that you want to keep track of. We recommend to deploy the code to the head <head> of the website. Most of the CMS offers a tool in the settings that will allow you to enter the code to all pages easily. Check, if the code is deployed well, in the management of Google Analytics.
Basic statistics from Google Analytics
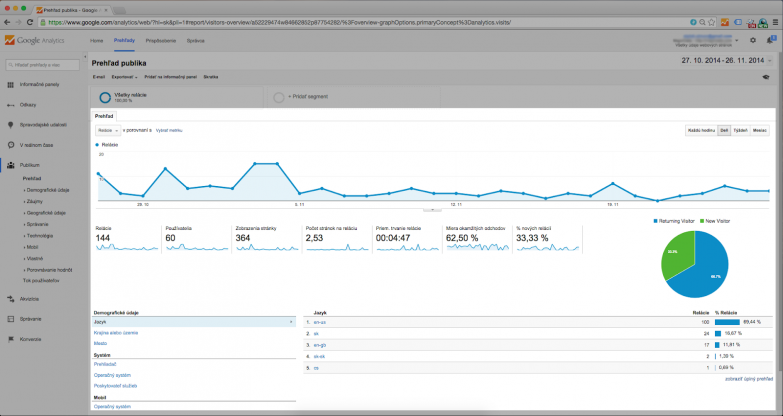
After correct setup you should see in a few hours the first data from your hosting in the Google Analytics. After a few days the monitor should look like the picture bellow. Basic settings of GA displays the number of relations (visitors) on your website in the last month.
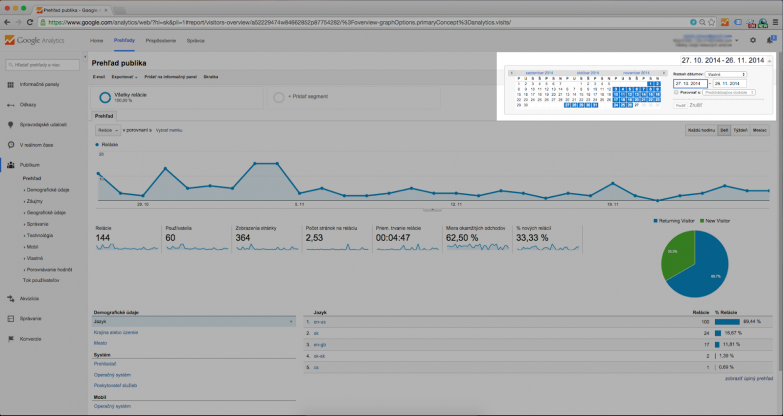
In a case you want to display more information then in the last month, you can select a date in the top right corner and adjust the displayed date.
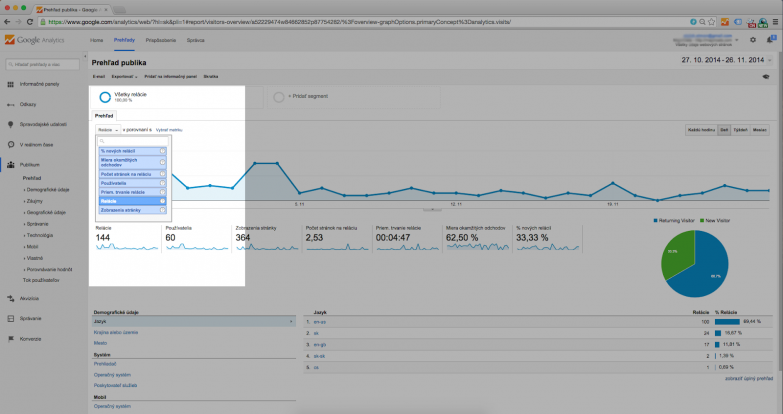
Except the relations you can display on the dashboard how many unique visitors you had and how long did they stayed (in average) on your website. On the left above the graph you can select what information should be displayed.
Except these information Google Analytics can display even some demographic data, like city, language or operating system from which you receive visitors the most. For more thorough information simply select the demographic detail you want more information about and select “display full overview“.
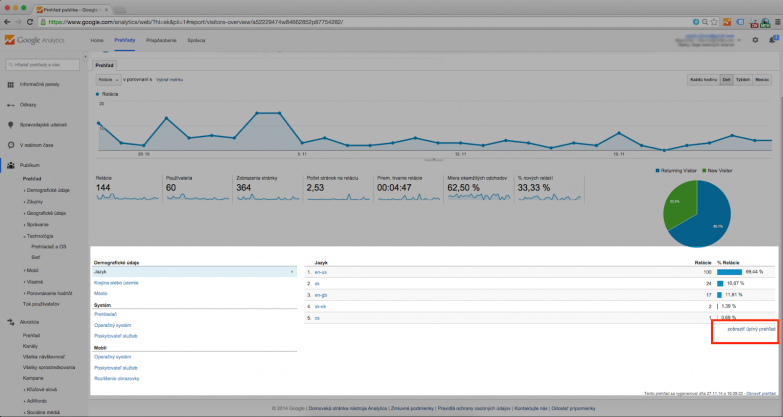
In a a case of operating system, you can see the overview of available OSs and how are the visits divided among them. You can also see the percent of immediate exits from your website based on OS. Percent of immediate exits means that the visitor visited your website, didn’t interact with it (haven’t clicked on anything) and exited immediately. This number should be the best, but its number depends on the website type.
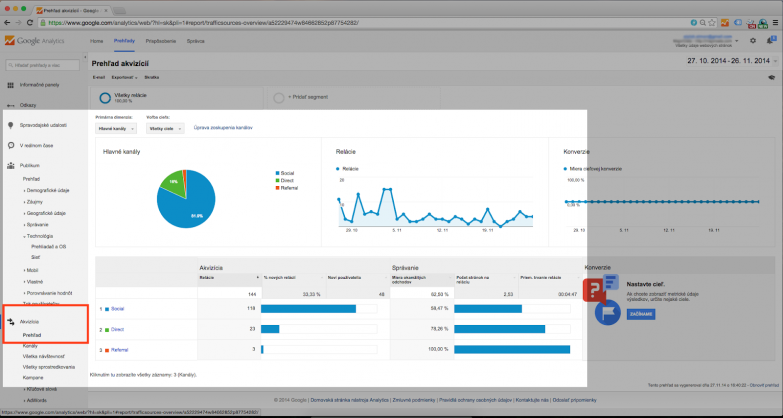
In the Google Analytics you can display from where the visitors came to your website. In the right menu you can select the option “Acquisition” and “Overview.” Then you will see, if the visitors came from a different website or if they entered your website URL to the browser.
Google Analytics offers more information, that you can keep track of. We will show you, how to keep track of orders or other targets (e.g. download rate of a specific document) on your website.